
Visualization from SciencEngines
Visualization is the use and display of quantitative or qualitative information using graphical or pictorial techniques. Visualization makes information easy to understand and control. The visual display is intuitive, ergonomic and economical.
Our visualization tools and systems use color, shape, size, orientation, displacement, motion and other visual strategies to make you data and applications come alive.
Examples
| Dashboards - Displays including gauges, indicators, thermometers, progress bars, custom tools, etc. |
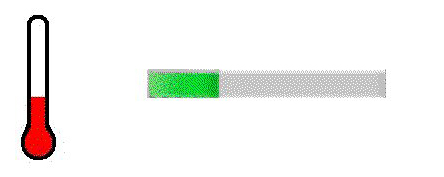 |
| Controls - Dynamically control your applications through sliders, scroll bars, incrementers and custom controllers. |
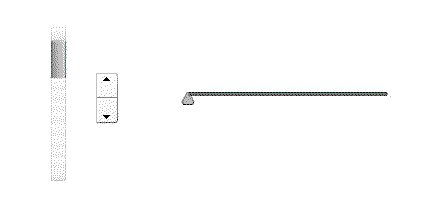 |
| Charts and Graphs - 2D and 3D pie charts, bar charts, line graphs, scatter diagrams, custom data displays, Gantt charts, etc. |
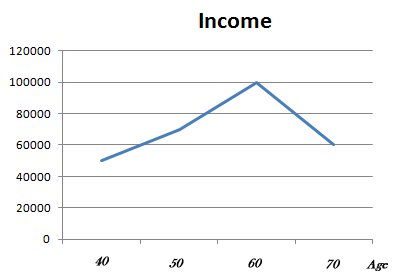
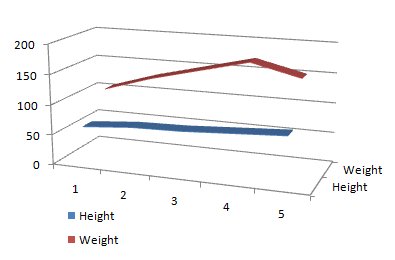
|
| Animation - Show equimpent operating, move data, add sound to your displays, create games, quizzes and other active displays. |
| Massive Data Display - Display and manipulate thousands of data points and still make them understandable. |
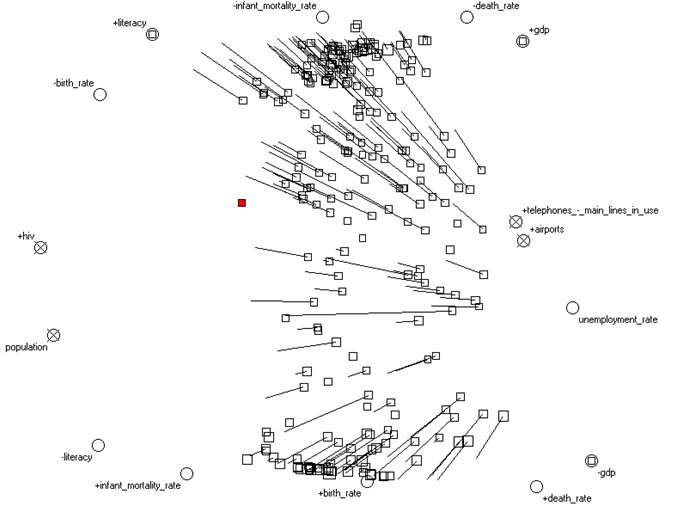 |
| Geographic Displays - Overlay all kinds of information on maps or other spatial displays. |