 |
| Etna Flooding Case Study |
|


|
    
|
|
| |
History
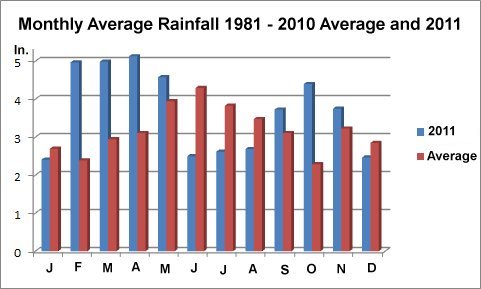
Etna and the area along Pine Creek and its tributaries have had a long history of flooding. Significant floods have occurred in the years 1936, 1968, 1972, 1986, 1987, and 2004. The table below shows that precipitation can vary widely for the region.
|
| | 1981 - 2010 | 2011 |
| January | 2.7 | 2.41 |
| February | 2.39 | 4.97 |
| March | 2.95 | 4.99 |
| April | 3.11 | 5.13 |
| May | 3.95 | 4.58 |
| June | 4.3 | 2.5 |
| July | 3.83 | 2.62 |
| August | 3.48 | 2.69 |
| September | 3.11 | 3.73 |
| October | 2.29 | 4.4 |
| November | 3.23 | 3.75 |
| December | 2.85 | 2.47 |
|
| |
| This variation is even more apparent in the bar chart below. |
| |
 |
| |
|
Your instructor observed all of the floods from 1968 on and was actually in the midst of the 2004 flood which killed 5 people. We will use the 2004 flood as an example to demonstrate the magnitude and effects of these floods. |
| |
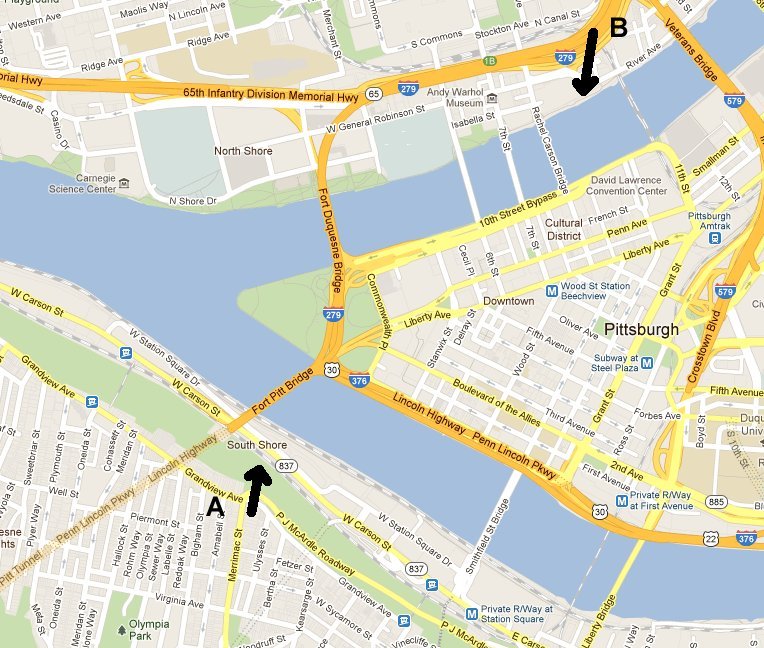
| The images below show pictures of flooding from 1972 and 2004. The following map gives the approximate location and direction in which the pictures were taken. "A" refers to the 1972 picture and "B" the 2004 picture. |
| |
 |
| |
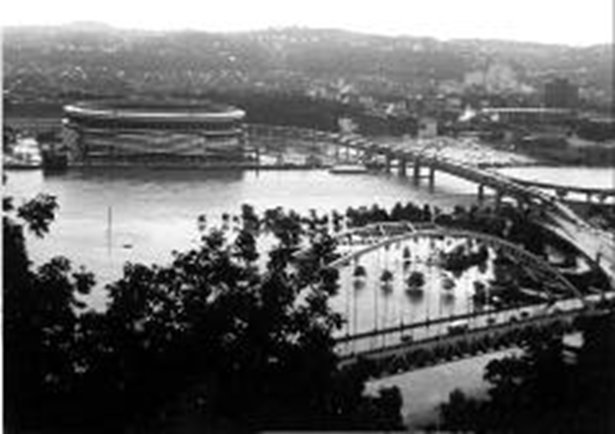
| The picture below is from the 1972 flood. Depicted is the area where the Allegheny and Monongahela Rivers come together to form the Ohio River. As one can see the entire Point State Park as well as the North Side around Three Rivers Stadium is under water. Use the map above to get aan idea of the areas covered. |
| |
 |
| |
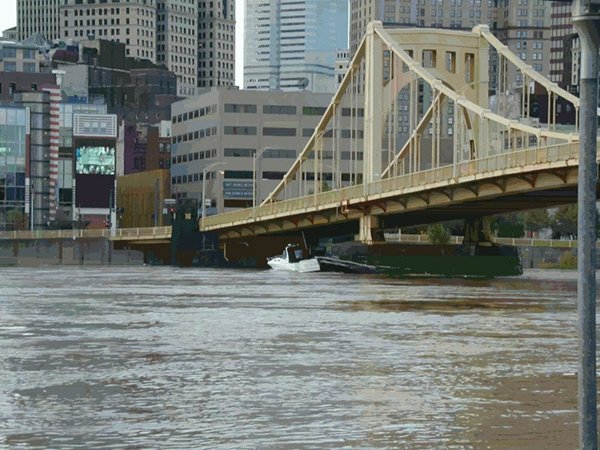
| Some of the effects of the 2004 flood are pictured below. The picture shows the Allegheeny river from the North Side. The road which goes under the bridge, The Roberto Clemente Bridge, is entirely under water. A pleasure boat was ripped from its moorings and is lodged against one of the bridgee piers. The level of the water would not permit tugboats and other river traffic to pass. |
| |
 |
| |
| River flooding is important for our case study because, as the river rises, it backs up into the tributary creeks such as Pine Creek in Etna. This reduces the caapability of the creek to deliver water from its watershed. |
| |
| The map below shows the efforts to develop dams and reservoirs to help control the flow of water into the rivers. |
| |
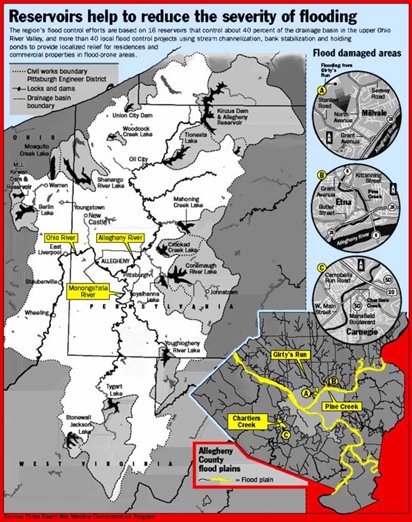 |
| |
| Exercise: |
Plenty of pictures and descriptions of past Pittsburgh floods exist on the Web. Use these pictures along with a good map to identify the areas that are impacted by floods. |
|
| |
|
| |
|
|
|
|
| Copyright © 2011 - 2014 Ken Sochats |