 | ||||||||||||||||||||||||||||||||||||||||||||||||||||||||
| Etna Flooding Case Study | ||||||||||||||||||||||||||||||||||||||||||||||||||||||||
  

 | ||||||||||||||||||||||||||||||||||||||||||||||||||||||||
   | ||||||||||||||||||||||||||||||||||||||||||||||||||||||||
| Flooding In this module we take a look at why flooding occurs. In our area the most common and dangerous types of floods are flash floods. In coastal areas floods are caused by tidal effects, storms, tsunamis and other phenomenon. Some types of costal flooding are to a certain degree predictable days in advance. Inland flooding is however due mostly to sudden thunderstorms or dams breaching. | ||||||||||||||||||||||||||||||||||||||||||||||||||||||||
| ||||||||||||||||||||||||||||||||||||||||||||||||||||||||
| ||||||||||||||||||||||||||||||||||||||||||||||||||||||||
| As we stated before, flash floods are predictable in the short term. We can however develop an understanding of where and to what intensity flooding will occur. For this purpose, scientists have developed the concept of a floodplain. | ||||||||||||||||||||||||||||||||||||||||||||||||||||||||
| ||||||||||||||||||||||||||||||||||||||||||||||||||||||||
The most common versions of floodplain are the 100 year floodplain and to a much lesser extent the 500 year floodplain. Insurance companies, regulators and others regularly use the 100 year floodplain to set insurance rates, establish building code, etc. Even the definition of what the floodplain means is fuzzy. For example, some define the 100 year floodplain as:
| ||||||||||||||||||||||||||||||||||||||||||||||||||||||||
The map below shows the 100 year floodplain for the creeks in the Etna area. As one can see the floodplain is composed of two components:
| ||||||||||||||||||||||||||||||||||||||||||||||||||||||||
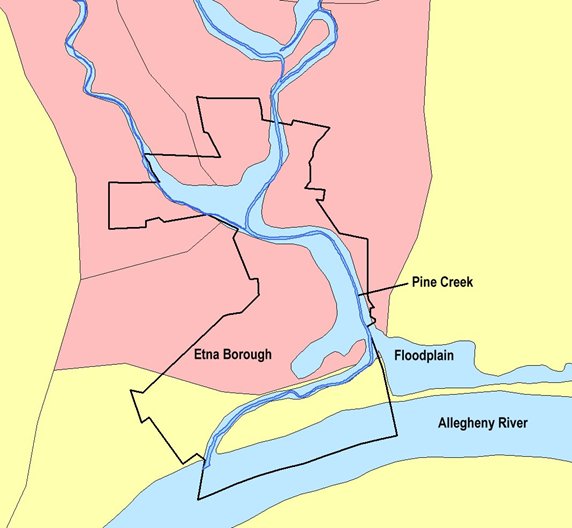 | ||||||||||||||||||||||||||||||||||||||||||||||||||||||||
| Flooding occurs, in the simplest sense, when a waterway is presented with more water than it can handle. | ||||||||||||||||||||||||||||||||||||||||||||||||||||||||
| ||||||||||||||||||||||||||||||||||||||||||||||||||||||||
| The map below shows the watershed for Pine Creek and its tributary Little Pine Creek in Etna. It also shows the watershed for Millvale (Girty's Creek), a neighboring community to the west that also has a long flooding history. | ||||||||||||||||||||||||||||||||||||||||||||||||||||||||
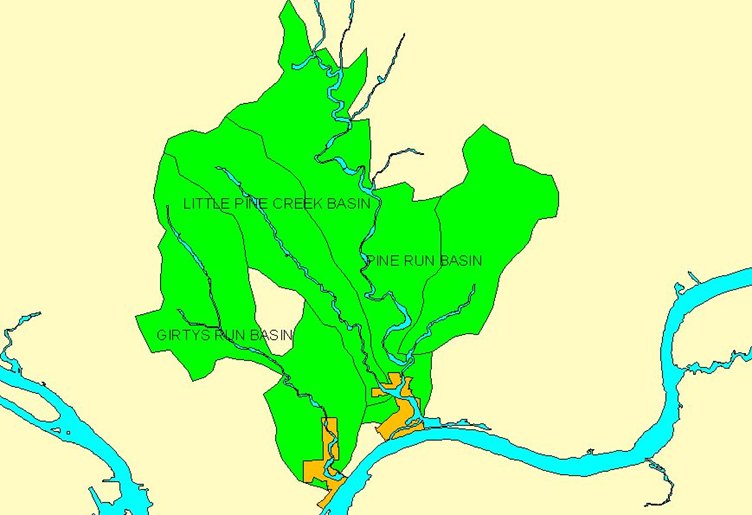 | ||||||||||||||||||||||||||||||||||||||||||||||||||||||||
| Any water that makes its way into the watershed may find its way to the waterway. Sometimes, some of the water leaves the watershed through other meechaanisms before entering the waterway. | ||||||||||||||||||||||||||||||||||||||||||||||||||||||||
| Note: While it it not the focus of this lesson, the watershed plays an important role in another type of disaster, the hazardous material spill. Any hazardous material that is spilled at any point in the watershed, will likely make its path into the waterway unless appropriate action is taken. | ||||||||||||||||||||||||||||||||||||||||||||||||||||||||
| ||||||||||||||||||||||||||||||||||||||||||||||||||||||||
We can view the watershed as a system-of-systems. Some of the systems that participate in the watershed are:
| ||||||||||||||||||||||||||||||||||||||||||||||||||||||||
| During normal operating times, there is enough water introduced into the watershed such that the waterway flows at some average normal rate. At other times, during storms say, the excess water causes the waterway to swell. | ||||||||||||||||||||||||||||||||||||||||||||||||||||||||
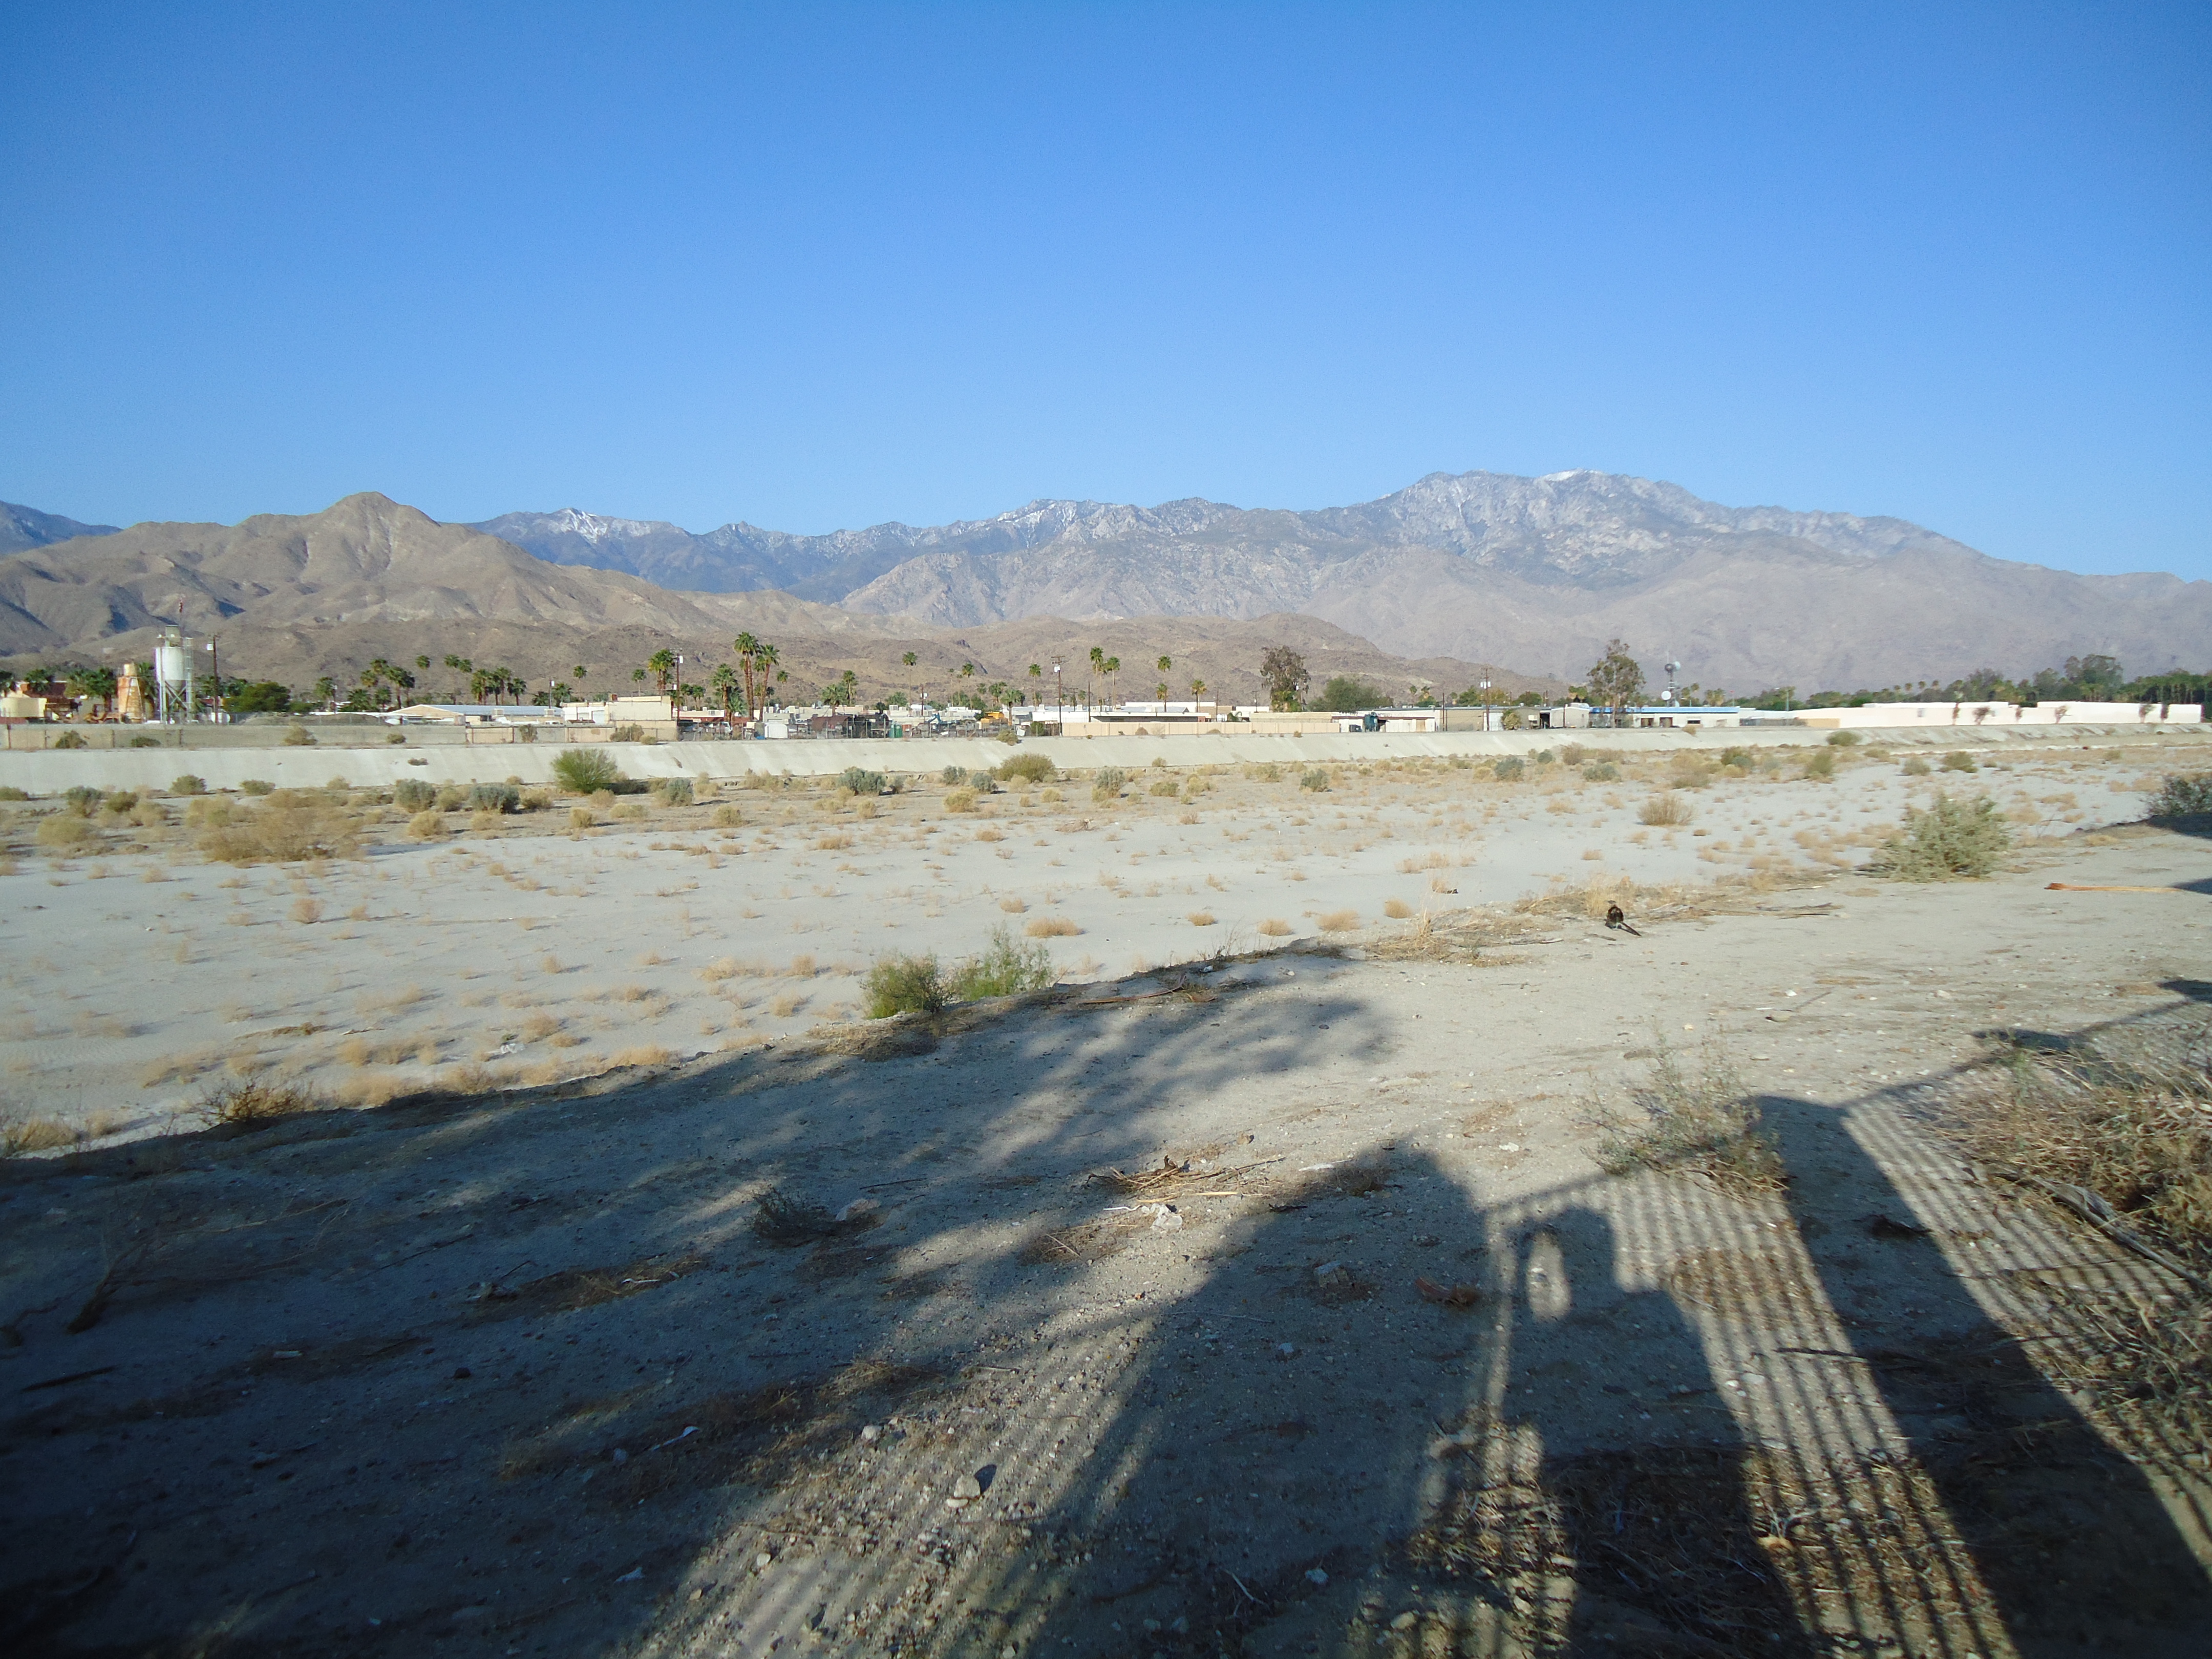
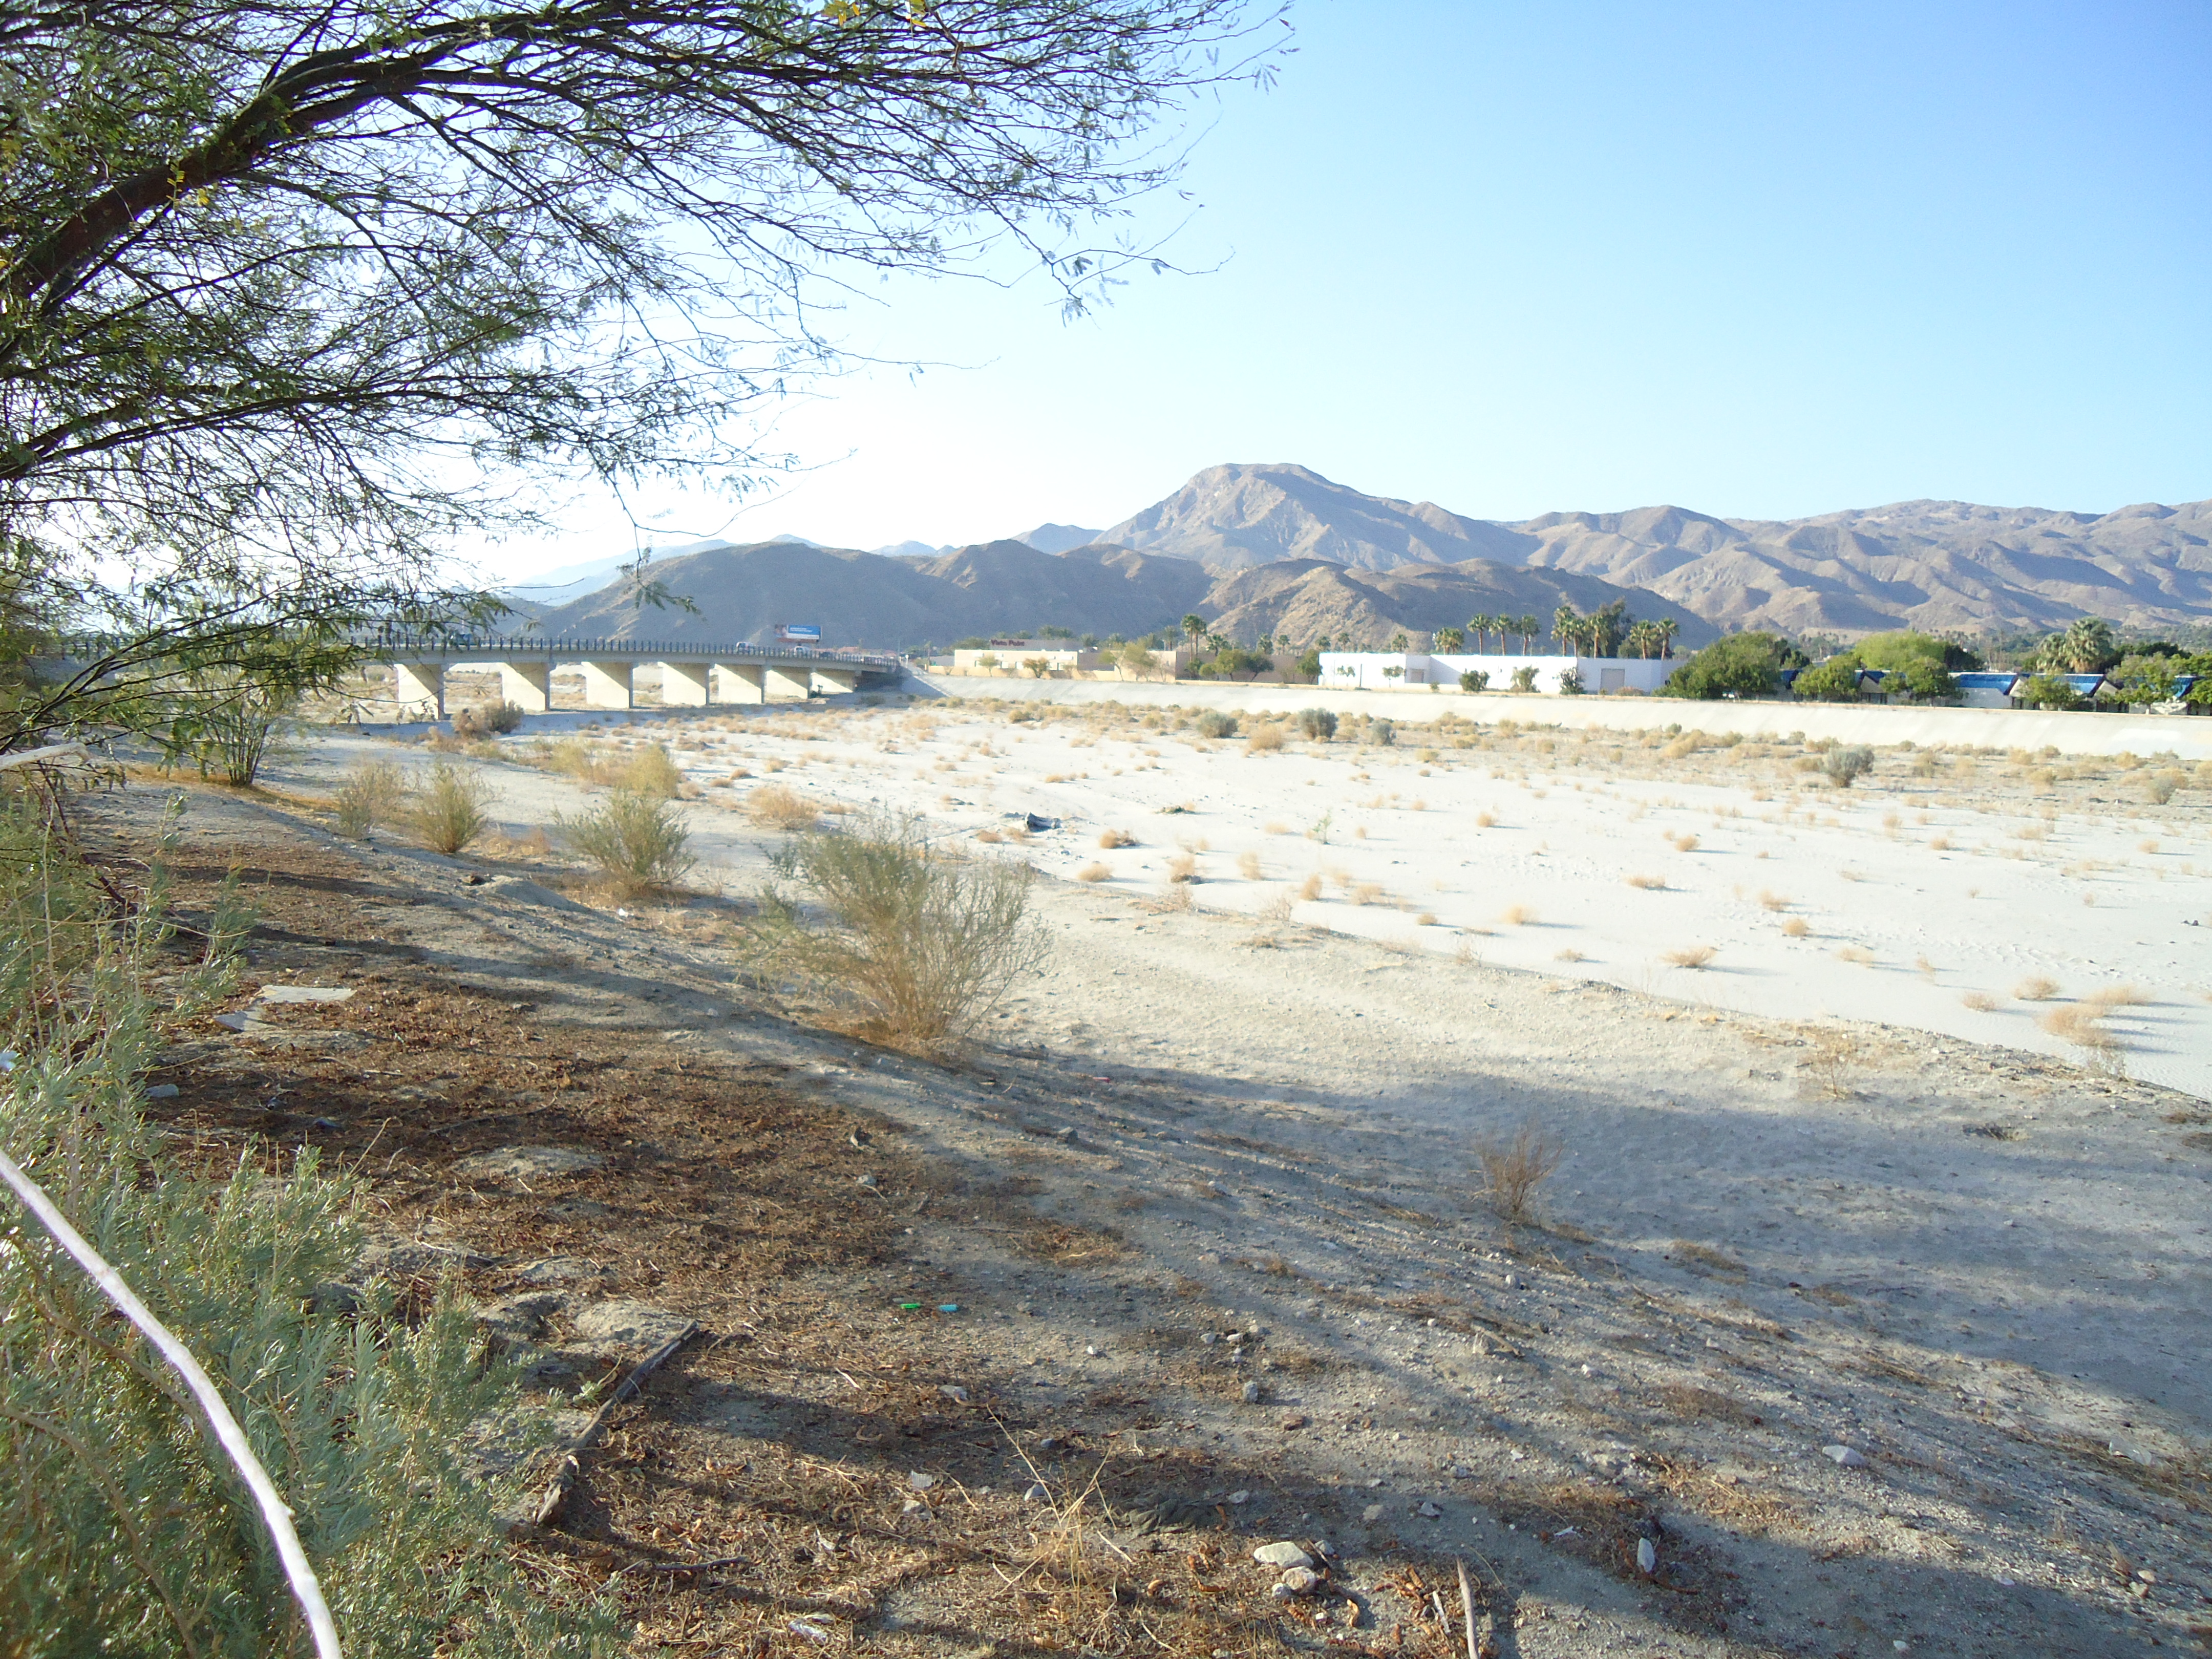
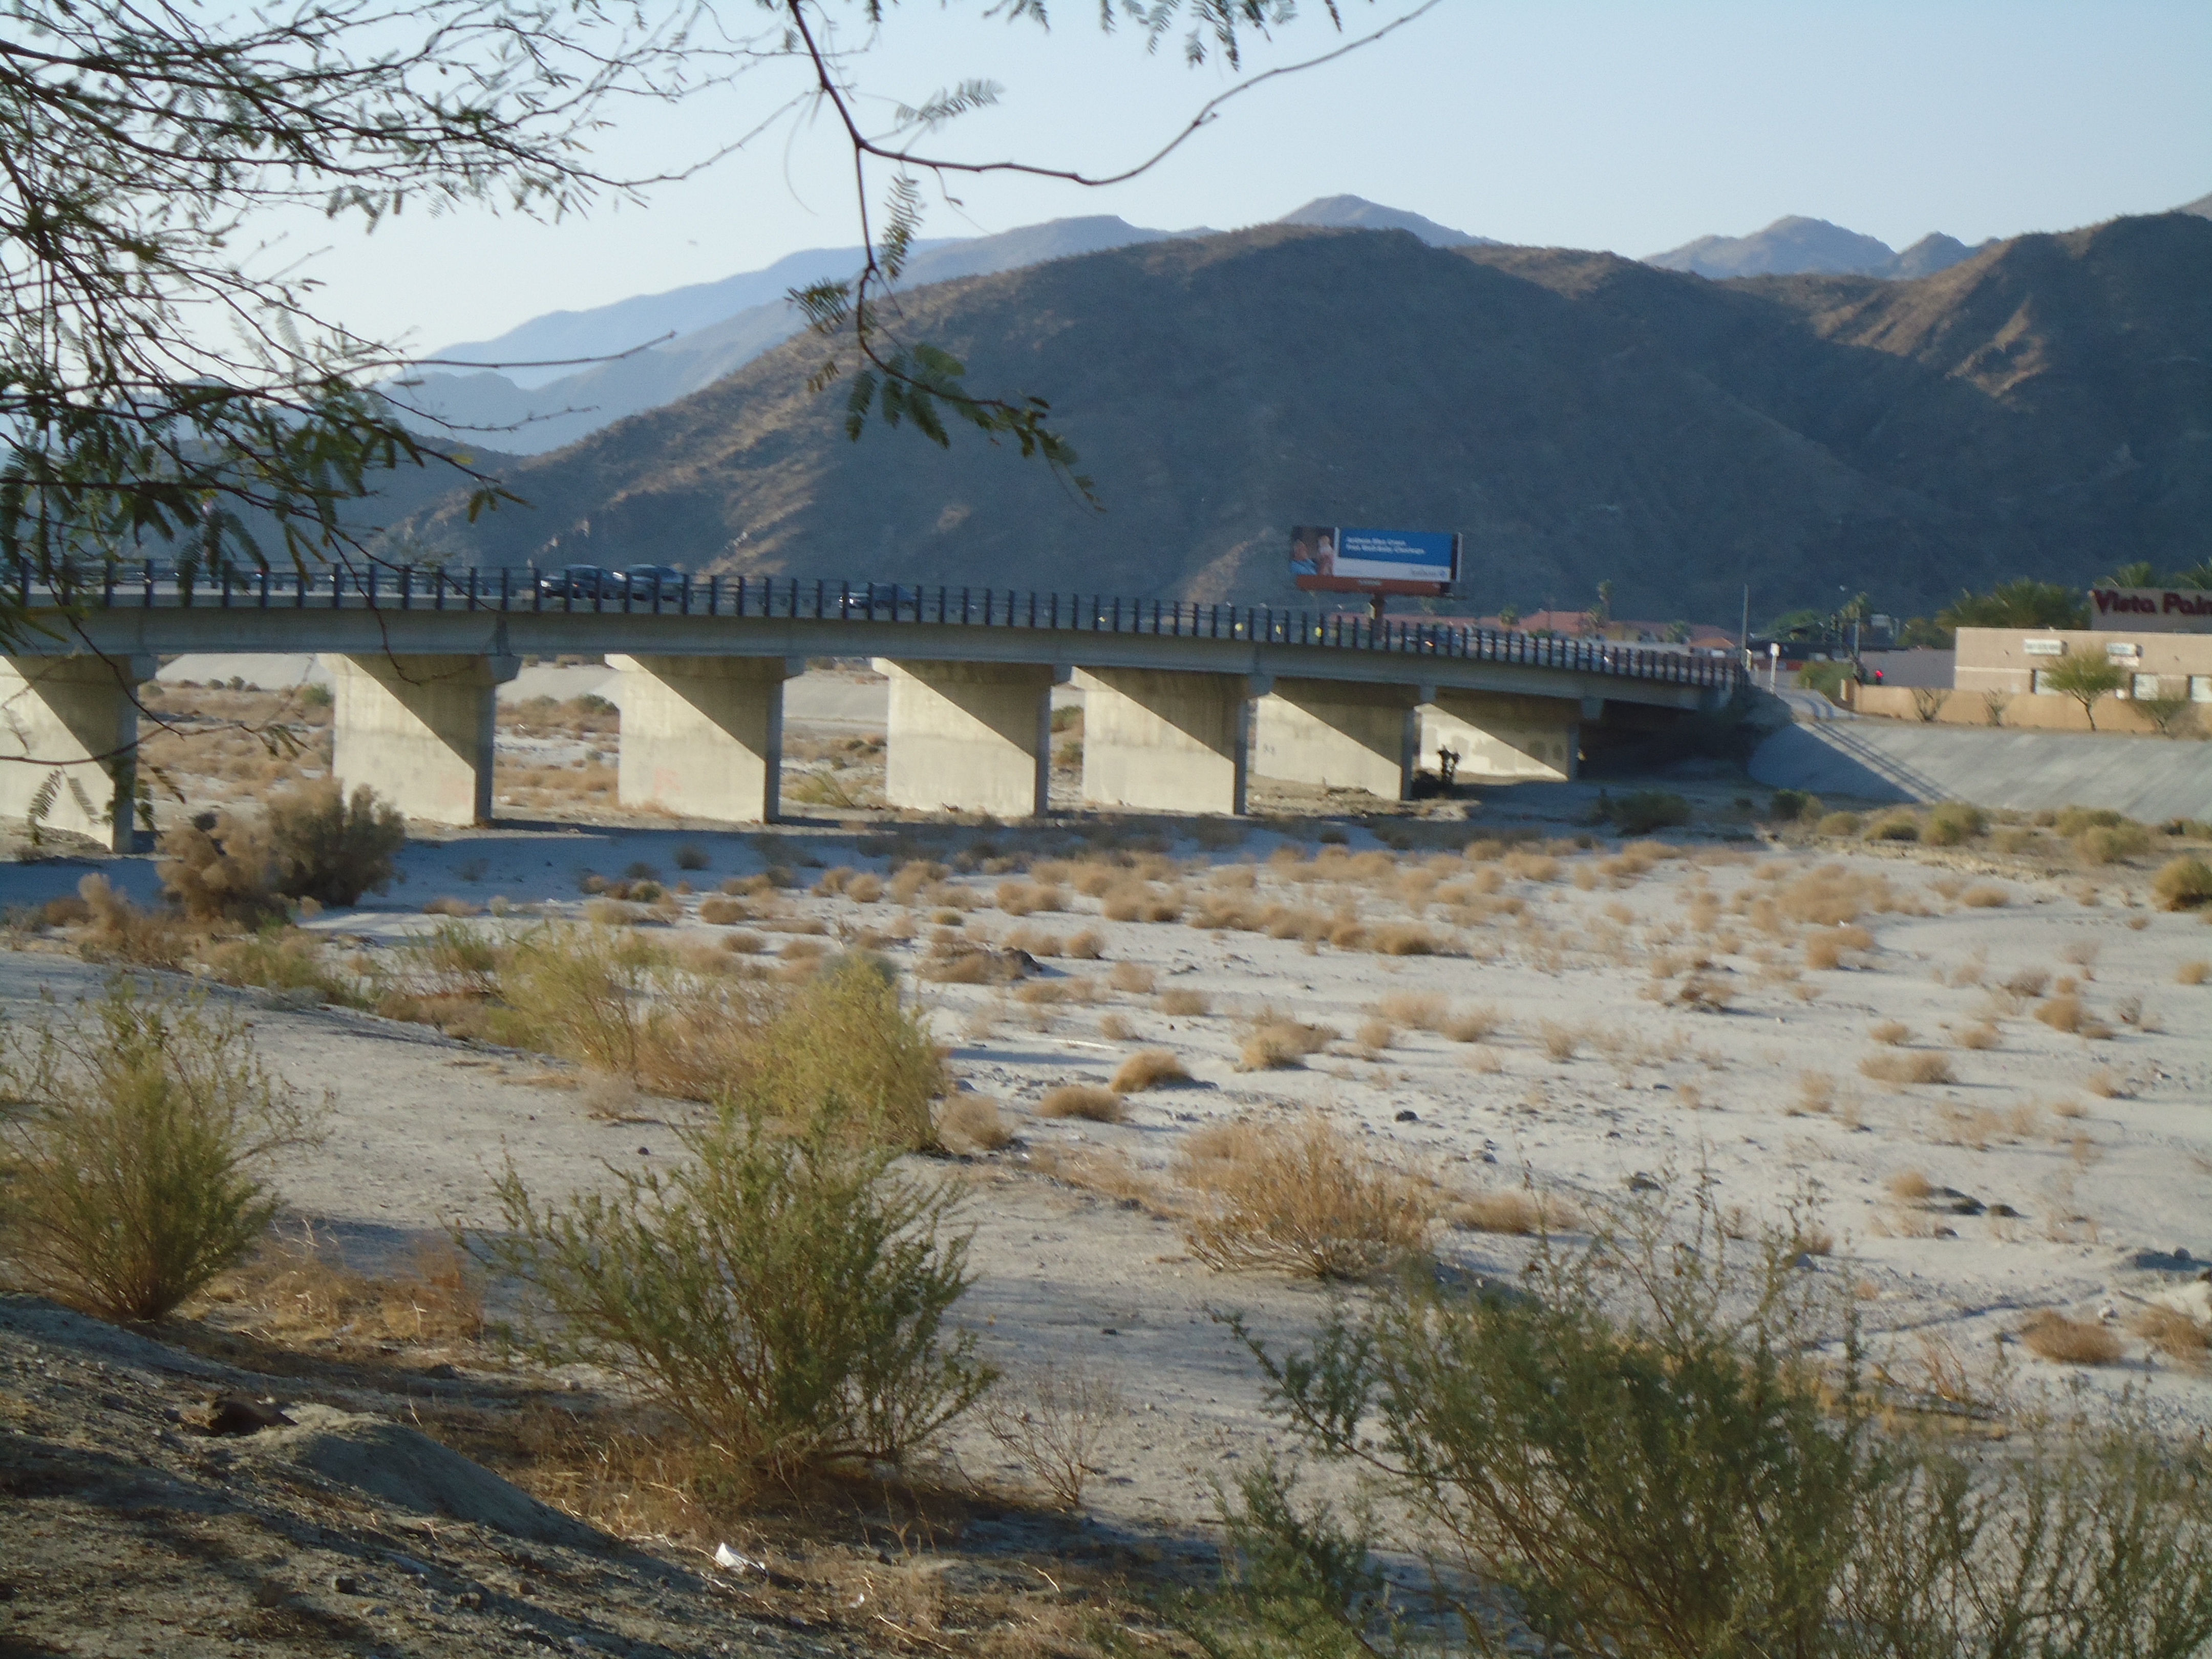
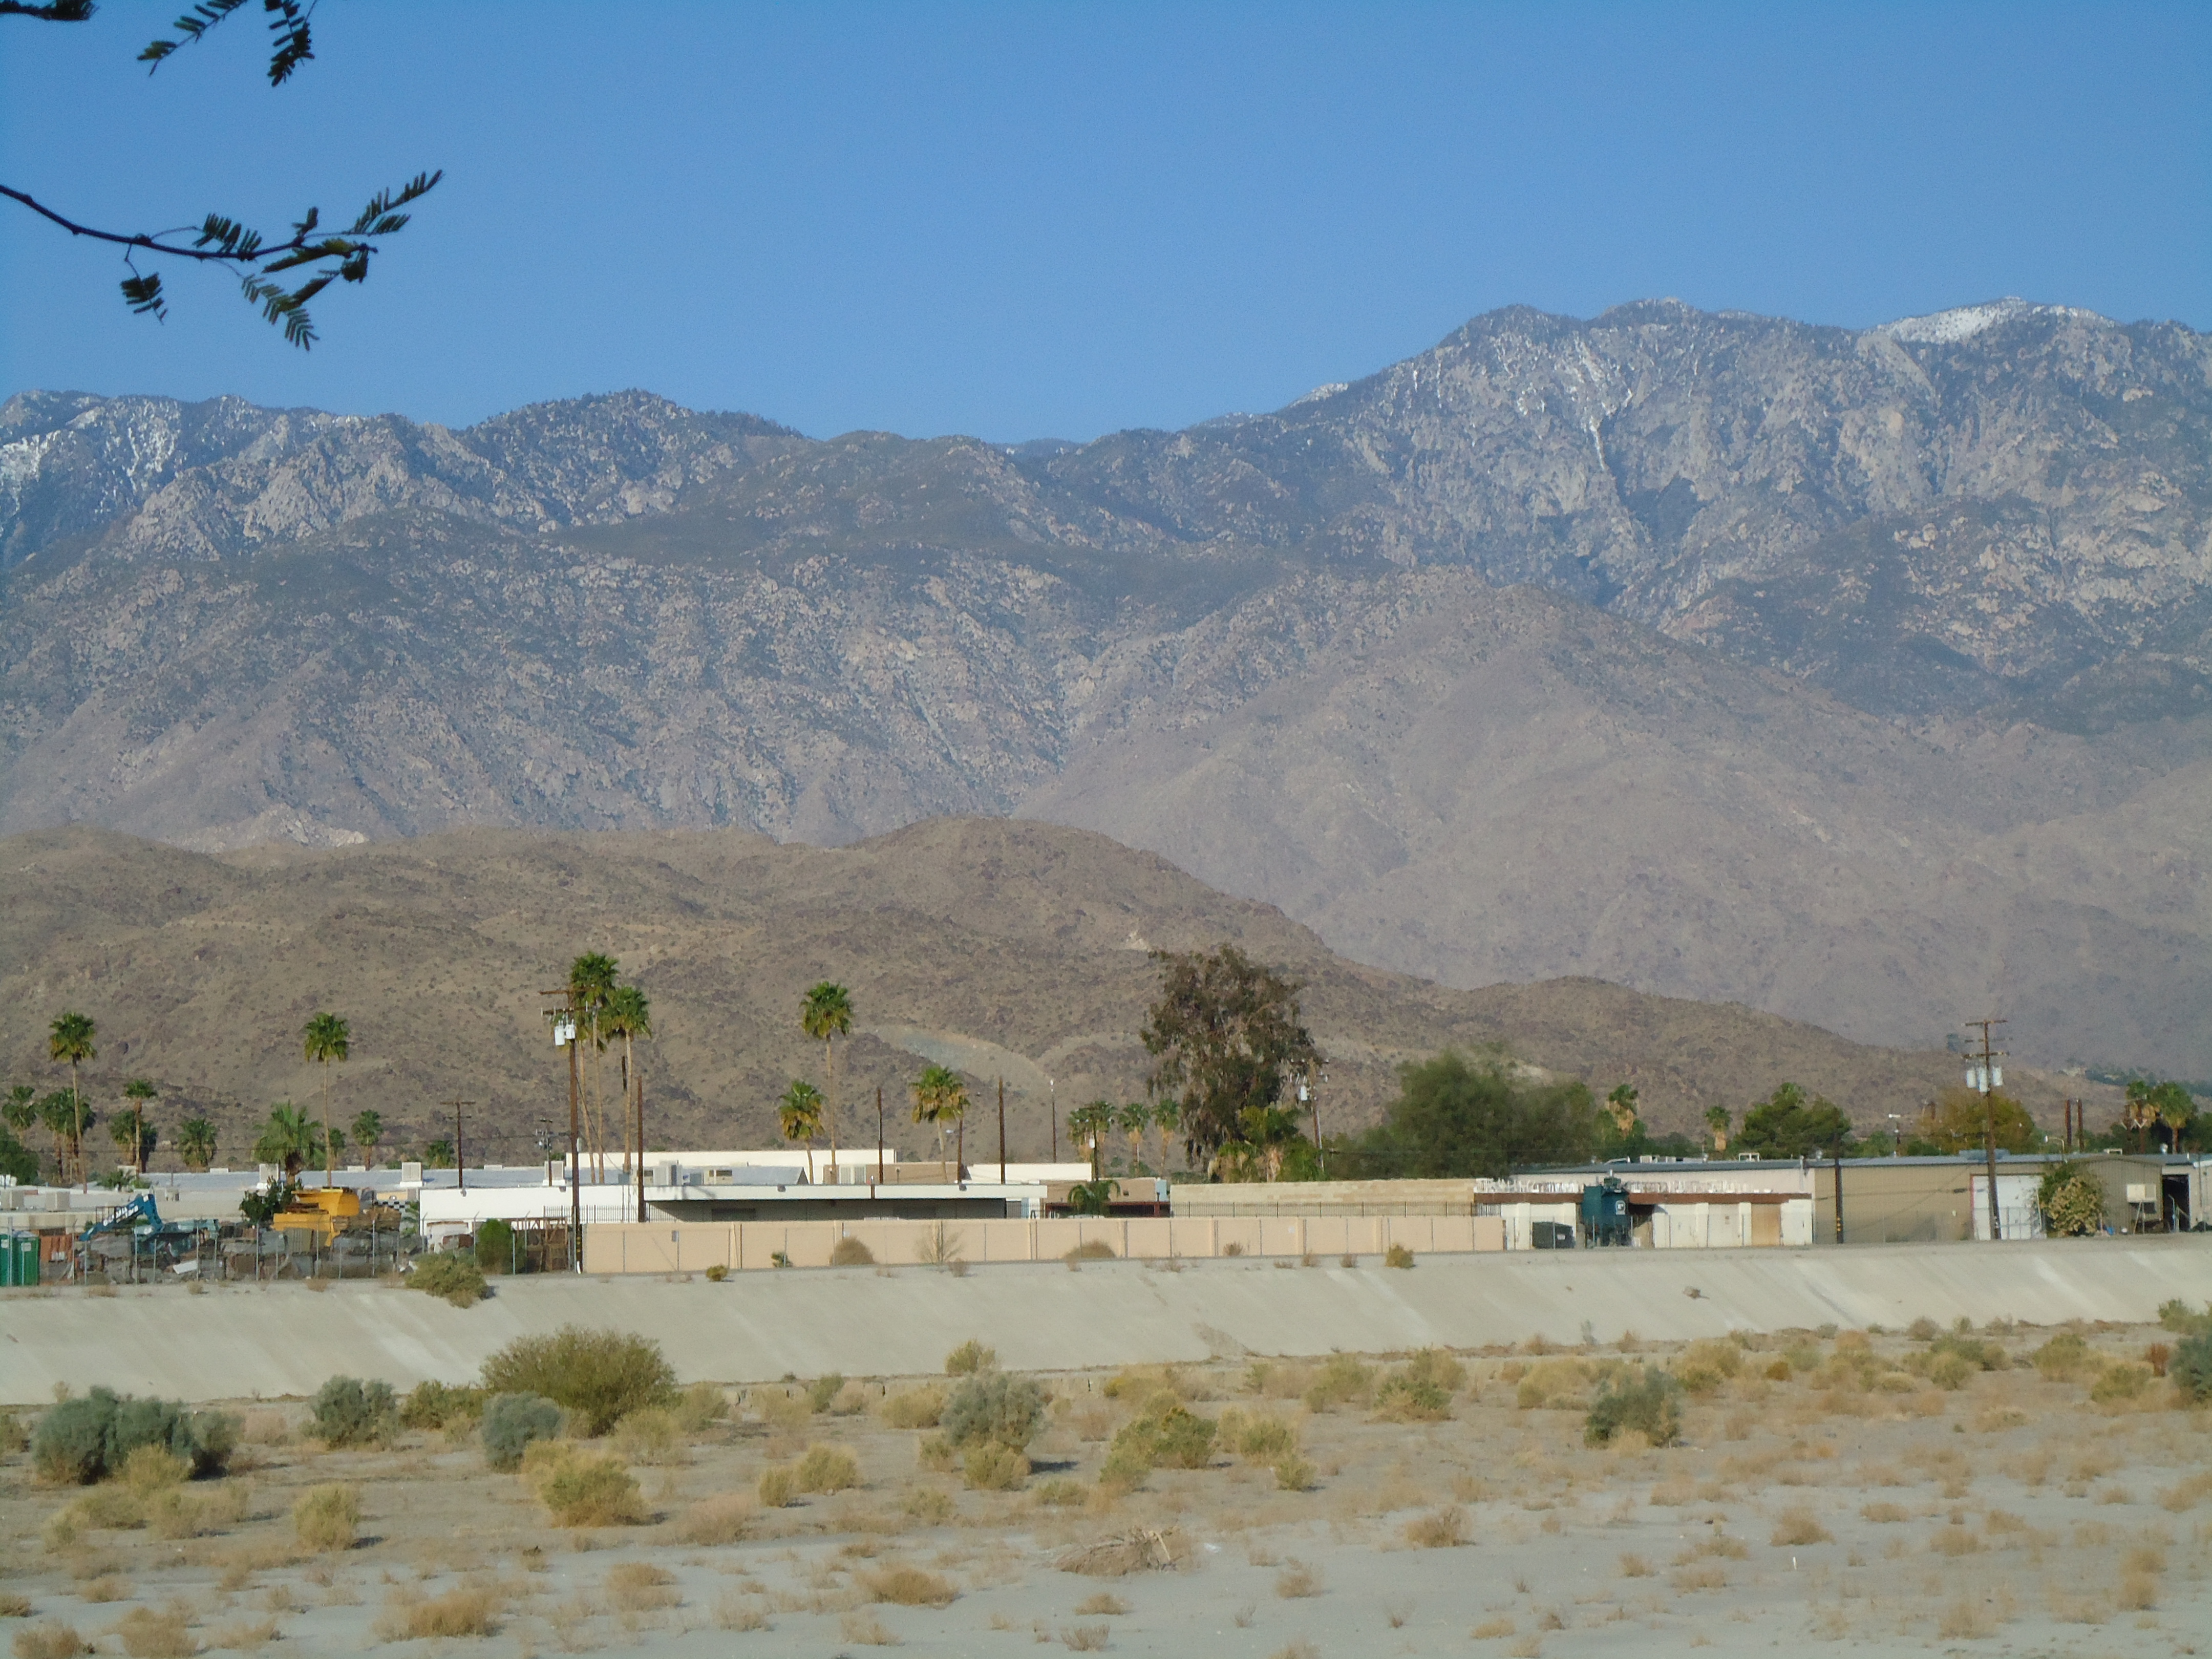
| As we saw from the precipitation statistics shown earlier, the precipitation does not vary widely over the year. This is not the case in other locations where there are alternating dry and wet seasons. This is particularly the case in the Western United States. The images below are from Palm Springs, California. The show what is commonly referred as a desert wash or dry was or desert gulch. For part of the year, the climate is very dry. The wash is completely dry or almost dry. During the rainy/snowy season, storms regularly occur. Because of the climate, there is little vegetation to catch and hold the runoff. Note the lack of trees, bushes and grass on the mountains. The water from the watershed rushes quickly into the wash. In many areas, municipalities have sectioned off the washes to prevent development and the resultant flooding there. | ||||||||||||||||||||||||||||||||||||||||||||||||||||||||
  | ||||||||||||||||||||||||||||||||||||||||||||||||||||||||
  | ||||||||||||||||||||||||||||||||||||||||||||||||||||||||
| A Simple Flood Model | ||||||||||||||||||||||||||||||||||||||||||||||||||||||||
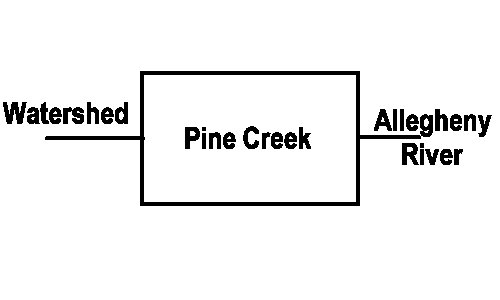
| It would be very useful for us to have a model that could predict the occurrence and effects of floods. But as we have noted, the watershed is a complex system-of-systems. In order to make this problem more tractable, we need to make some simplifying observations and assumptions. We begin by making the observation that for Pine Creek to be sustained, the amount of water entering the system must be the same as the amount leaving. We represent this with the simple "black box" model as shown below. We will measure this amount and use this as a benchmark for our flood model. | ||||||||||||||||||||||||||||||||||||||||||||||||||||||||
 | ||||||||||||||||||||||||||||||||||||||||||||||||||||||||
| Pine Creek at Etna | ||||||||||||||||||||||||||||||||||||||||||||||||||||||||
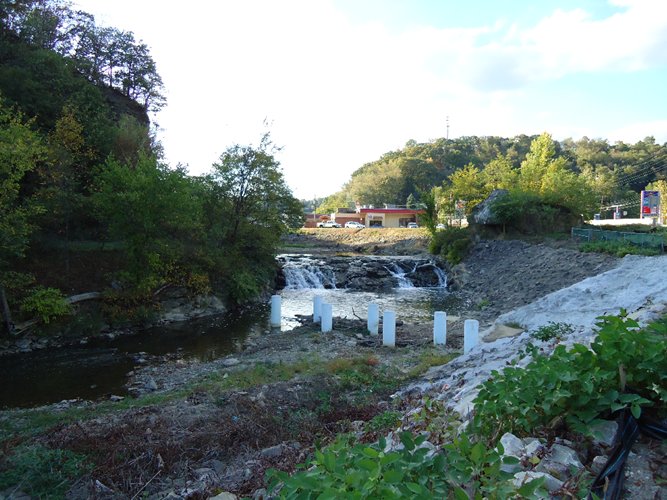
| At Etna, Pine Creek normally is about ten feet wide and two feet deep and flows at 8 miles per hour. This means that 844,800 cubic feet of water flows past in an hour ( 10 ft. * 2 ft. * 5280 ft./mi. * 8 mi./hr. ). This translates into 6,319,526 gallons. ( 1 cubic foot = 7.48051948 US gallons ). In order for thie creek to flow continuously, this amount of water must be introduced into the watershed each hour. The photograph below shows this situation. | ||||||||||||||||||||||||||||||||||||||||||||||||||||||||
 | ||||||||||||||||||||||||||||||||||||||||||||||||||||||||
| Our next step in model building is to make the model more complex. In this model we consider the introduction of rain. We are essetially going to assume that all of the other factors are small in effect and constant. In other words, the effects of the rain will be much larger than the efects of the human, natural, geo and economic system combined. | ||||||||||||||||||||||||||||||||||||||||||||||||||||||||
| The Pine Creek watershed occupies an area of 67.39 square miles. A one inch rainfall will produce a volume of water of 156,560,448 cubic feet or 1,171,153,481 gallons of water. If that rain occurs rapidly as in a thunderstorm, one inch of rain in one hour is not uncommon. The volume of water from this rain storm is 177 times the amount of water that the creek clears in a normal hour (844,800 cubic feet of water). While not all of this water reaches the creek at the same time we can use this as a worst case to set bounds. In the case of constant creek size, for the creek to clear the water, the water must flow at 1416 mi./hr. (8 mi./hr. * 177). If the speed of the water (8 mi./hr.) is held constant, then the crossectional area of the creek (20 ft2.) will increase to 3540 ft2. The real answer lies somewhere in between. The creek will speed up and get wider and deeper. Models like this help us reason about flooding. To refine the model, we can scale the model for the case of different rates of rain in an hour. We can add effects of snow on the ground, debris blockage or other factors. The importance of the model is that it is quick and easy to calculate and wasy to understand. As a final note we recognize that a gallon of water weighs 8.35 pounds or 62.43 pounds per cubic foot. With the velocity and volumes of flooding water, much force is exerted. It is easy to see why a car, tree or even a person can easily be swept away. | ||||||||||||||||||||||||||||||||||||||||||||||||||||||||
| ||||||||||||||||||||||||||||||||||||||||||||||||||||||||
| ||||||||||||||||||||||||||||||||||||||||||||||||||||||||
| ||||||||||||||||||||||||||||||||||||||||||||||||||||||||
| Copyright © 2011 - 2014 Ken Sochats | ||||||||||||||||||||||||||||||||||||||||||||||||||||||||